Measuring What Matters: An Evaluation Framework for Instance Segmentation Under Real-World Constraints
By Jacob Cossette
A computer vision project comparing SOLOv2, Mask R-CNN, and U-Net for waste segmentation, and the evaluation methodology built to compare them fairly.
The problem
Automatic waste detection sounds simple until you try to deploy it. A sorting facility or a mobile inspection device needs to segment, not just classify, multiple and often overlapping pieces of trash in cluttered, poorly lit scenes, usually on hardware with limited compute. That last constraint is the one most comparisons skip: papers report accuracy and rarely the compute budget required to get there.
This project set out to compare three instance segmentation architectures, SOLOv2, Mask R-CNN, and U-Net, for waste segmentation on the TACO dataset (Trash Annotations in Context), with one explicit constraint: any recommendation had to account for resource-limited environments, not just raw accuracy.
Three architectures, three design philosophies
SOLOv2 skips the "propose boxes, then segment" pipeline entirely. It predicts masks directly from the feature map through a kernel branch (dynamic, per-cell mask generation) and a feature branch, fused via pyramidal feature fusion and cleaned up with non-maximum suppression. Its loss combines Focal Loss (to handle class imbalance, since most grid cells contain no object) and Dice Loss (to sharpen mask boundaries, useful for small, oddly shaped waste items).
Mask R-CNN builds on Faster R-CNN, adding a segmentation branch on top of classification and bounding box regression. RoIAlign corrects pixel-level misalignment between region proposals and feature maps, a detail that matters for precise waste boundaries. Its loss is a weighted sum of three independent terms: classification (cross-entropy), box regression (Smooth L1), and mask prediction (per-pixel binary cross-entropy).
U-Net served as the project's baseline. Its encoder-decoder structure with skip connections re-injects high-resolution, low-level detail (edges, textures) from the encoder directly into the decoder, which matters when objects are small or partially occluded, a common case for scattered debris.
Designing a fair comparison
The technical detail that matters most here isn't any single architecture. It's the discipline of holding variables constant so the comparison actually means something:
Same backbones across all models. ResNet-50 and ResNet-18, both pretrained on COCO, tested independently so the backbone's own resource footprint could be isolated from the head architecture's.
Same dataset. TACO: 1,500 officially annotated images, 28 super-categories, 60 subcategories, manually annotated masks in COCO format, spanning realistic and varied backgrounds (a deliberate choice over cleaner but less representative waste datasets).
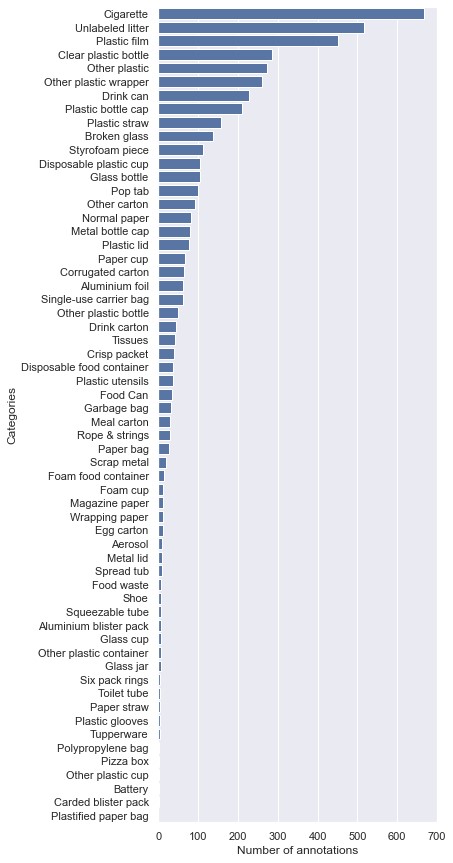
TACO's long-tail category distribution — a handful of common items (cigarettes, plastic film, bottles) dominate, with dozens of rarer sub-categories in the tail. This imbalance is exactly what Focal Loss in SOLOv2 is designed to compensate for.
Same training regime. Learning rate 1e-4, batch size 10, 30 epochs, single worker, run inside a pinned Conda environment (CUDA 11.7, PyTorch 2.0.0, MMCV 2.0.4, MMDetection), so results would be reproducible and attributable to the architecture rather than to an uncontrolled hyperparameter or library version.
Without this, a "SOLOv2 beats Mask R-CNN" headline is meaningless. It might just mean one model got a better backbone or a longer training run.
The measurement framework: three axes, not one
This is the core contribution of the project: accuracy alone doesn't answer the deployment question, so the evaluation was designed around three independent axes.
1. Accuracy: mAP. Mean Average Precision at IoU thresholds of 0.5 and 0.5:0.95, computed by measuring the overlap between predicted and ground-truth masks. Standard in computer vision, and necessary, but not sufficient on its own. Tracked through TensorBoard logs generated during inference so results were comparable across runs.
2. Efficiency: overlap threshold. A stricter, deployment-oriented pass/fail criterion layered on top of mAP: a predicted mask only counts as a correct detection if at least 50% of it overlaps with the ground truth. This answers a more operational question than mAP alone, namely whether a model produces usable detections often enough, rather than an averaged precision score that can hide inconsistent behavior.
3. Resource usage: FLOPs and parameter count. Measured with MMDetection's get_flops.py for each model, backbone, and input-size combination. Since one of the project's underlying questions was whether any of these models is viable inside a resource-constrained agent (embedded sorting hardware, a mobile device), computational cost had to be a first-class metric, not an afterthought discussed only if accuracy allowed.
The point of structuring the evaluation this way: a model that wins on mAP but requires 4x the compute isn't automatically the right answer for every deployment target. Making that trade-off visible was the actual goal. The specific numbers were secondary to having a methodology that surfaces the trade-off at all.

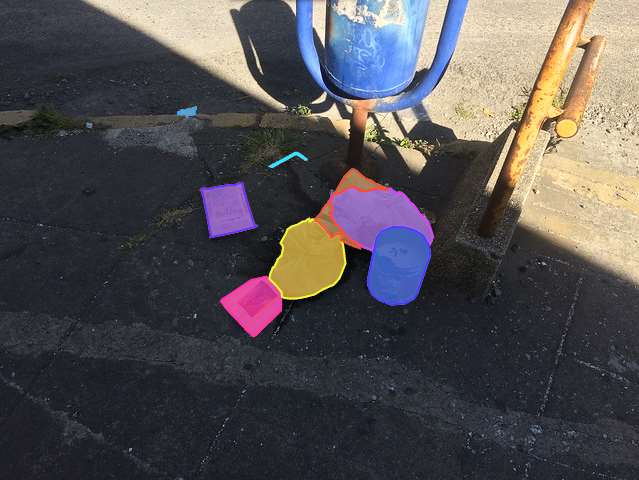
A raw TACO photo (top) and the corresponding instance-segmentation output (bottom) — six separate waste items masked out of a cluttered, unevenly lit street scene. This is the everyday difficulty the evaluation framework had to account for: overlapping objects, harsh shadows, and no clean background to fall back on.
When the pipeline breaks: the part evaluation work actually is
The honest part of this project is that the final head-to-head numbers were never fully produced, and it's worth explaining why, because diagnosing it was as much of the work as the architecture comparison itself.
MMDetection and TACO are both effectively unmaintained; TACO hasn't seen active maintenance in roughly four years. That surfaced as concrete, blocking problems: duplicate annotation IDs, missing image files, and inconsistent annotations in the dataset, plus undocumented and incompatible library version requirements across PyTorch, CUDA, and MMDetection in the tooling. Each had to be diagnosed and manually fixed: deduplicating entries, backfilling missing files, and downgrading specific library versions until the pipeline ran end to end.
An evaluation framework is only as trustworthy as the pipeline that feeds it. A perfectly designed set of metrics is worthless if the data underneath it is silently corrupted, which is exactly why the debugging work above is part of the evaluation story rather than a footnote to it.
Drawing conclusions responsibly
With the custom training pipeline still unreliable by the project deadline, the choice was between forcing out a partial or misleading number and being explicit about what could and couldn't be claimed. I chose the latter. Rather than presenting incomplete in-house results as final, the report cross-references a comparable, peer-reviewed experiment (Xu et al., 2024, on garbage segmentation with TACO), which found Mask R-CNN ahead on mAP and mAP50, while SOLOv2 was faster and lighter on resources. That's consistent with what the architecture comparison above would predict, but it's explicitly cited, not claimed as this project's own result.
That distinction, between what was measured here and what is being referenced from elsewhere, is itself part of the evaluation discipline. A recommendation is only as credible as the evaluator's clarity about its own evidence.

Per-class filtering on the same evaluation pipeline: only the "plastic" class surfaced here, isolating a bottle wedged against a curb. Deployment-facing questions, like "did we catch the plastic," often need this kind of class-level breakdown, not just an aggregate mAP.
Takeaways
Design the comparison as a controlled experiment: fix backbones, dataset, and training hyperparameters before comparing anything else. Evaluate across independent axes, since accuracy, efficiency, and resource use each answer a different deployment question, and collapsing them into one score hides the trade-off that actually matters. Treat the data and tooling pipeline as something that itself needs validation; unmaintained frameworks and degraded datasets are the norm, not the exception, in applied ML work. And be precise about the boundary between measured and cited results, especially when the honest answer is that the pipeline didn't get there in time.
The same discipline, multi-axis metrics, controlled comparisons, and rigorous handling of messy real-world data and tooling, is what I now apply to evaluating production AI systems more broadly, including agentic and LLM-based workflows, where "did it work" is rarely a single number either.
Download the full report (PDF): full literature review, loss function derivations, dataset analysis, code appendix, and environment specification.